The 60 Andalusian seats, poll by poll: this is how the AndalucíaYa 29-N aggregator works
AndalucíaYa calculates with all published polls how the 60 deputies of Andalusia would stand on 29-N, province by province and with a simulator. We explain what it offers, what it says today, the option with and without the CIS and how to follow it.
Redacción
·
Photo: AndalucíaYa
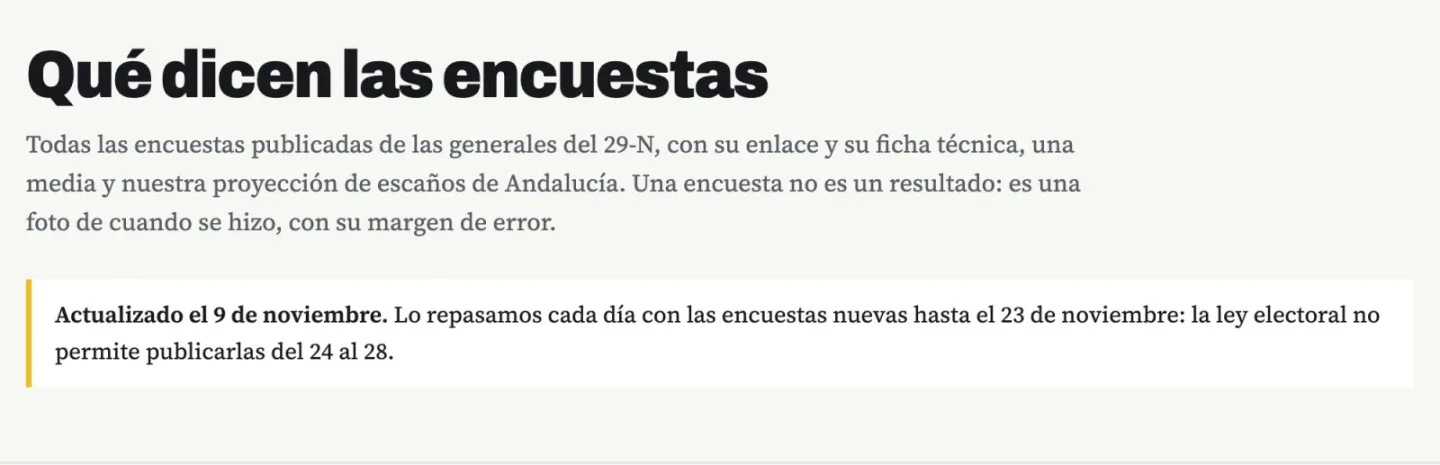
Andalucía elects 60 of the 350 deputies in the Congress, one fewer than in 2023 because Cádiz goes from 9 to 8. It is the community that distributes the most, but national polls almost never say how things would turn out here. For that, the AndalucíaYa general election special has a section, «What the polls say», that gathers all published polls and calculates the seats for the eight provinces.
In this report we go through it from top to bottom and show you how to use it.
The start of the section, with the date of the last revision. Photo: AndalucíaYa
At a glance
What the section contains
—Our projection: vote and seats, with a range.
—The national average the calculation starts from.
—The 60 seats, province by province.
—Their weekly evolution, with and without the CIS.
—The figures the institutes give for Andalucía.
—The simulator to make your own calculation.
—All the polls, linked.
—The method, in case you want to check it.
What it says today for Andalucía
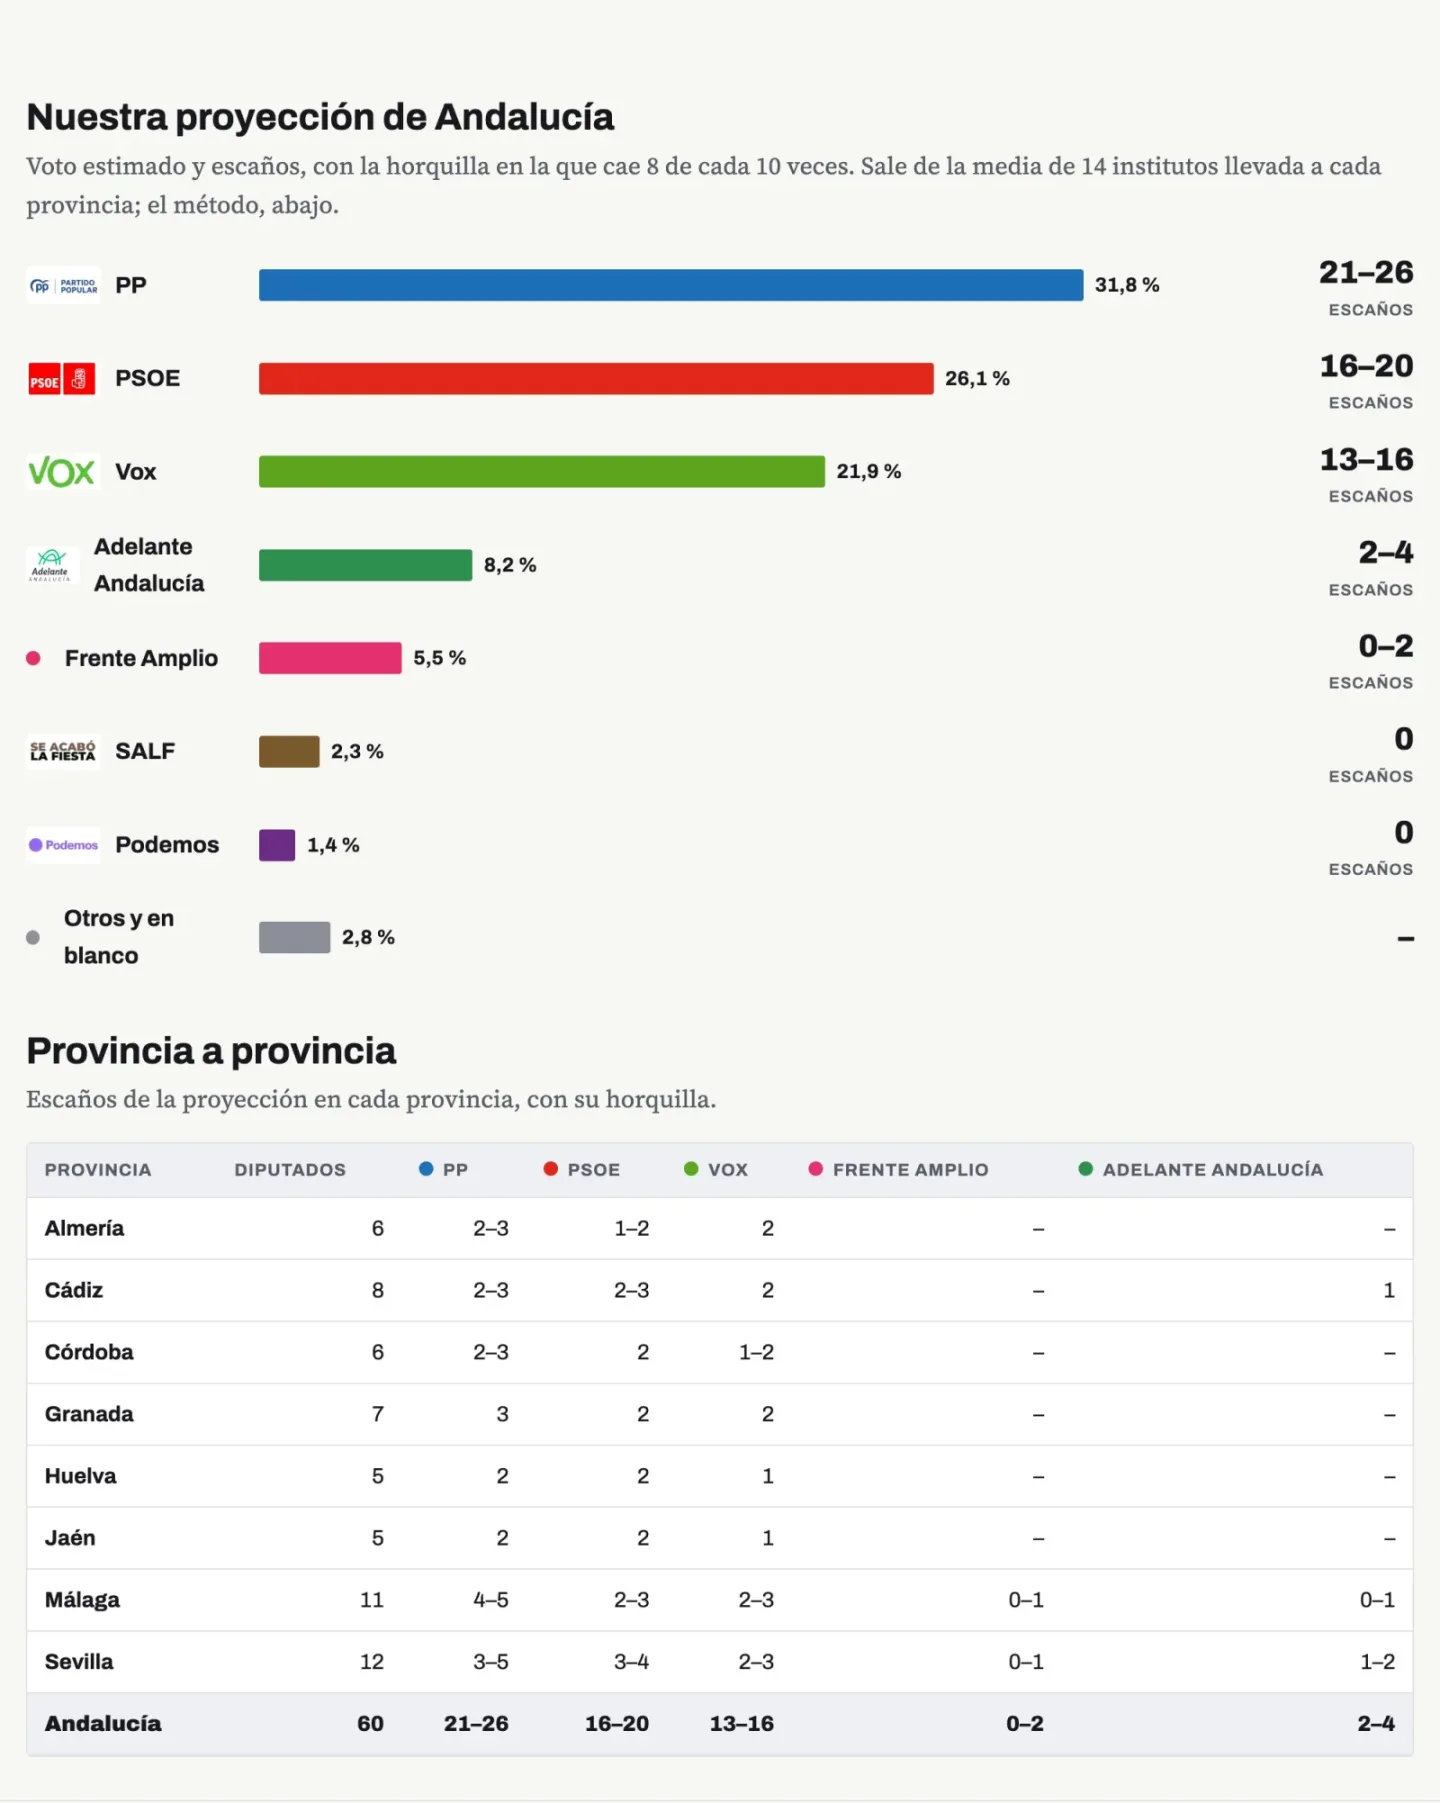
This is how the Andalucía projection looks in the special, with figures from November 9. Photo: AndalucíaYa
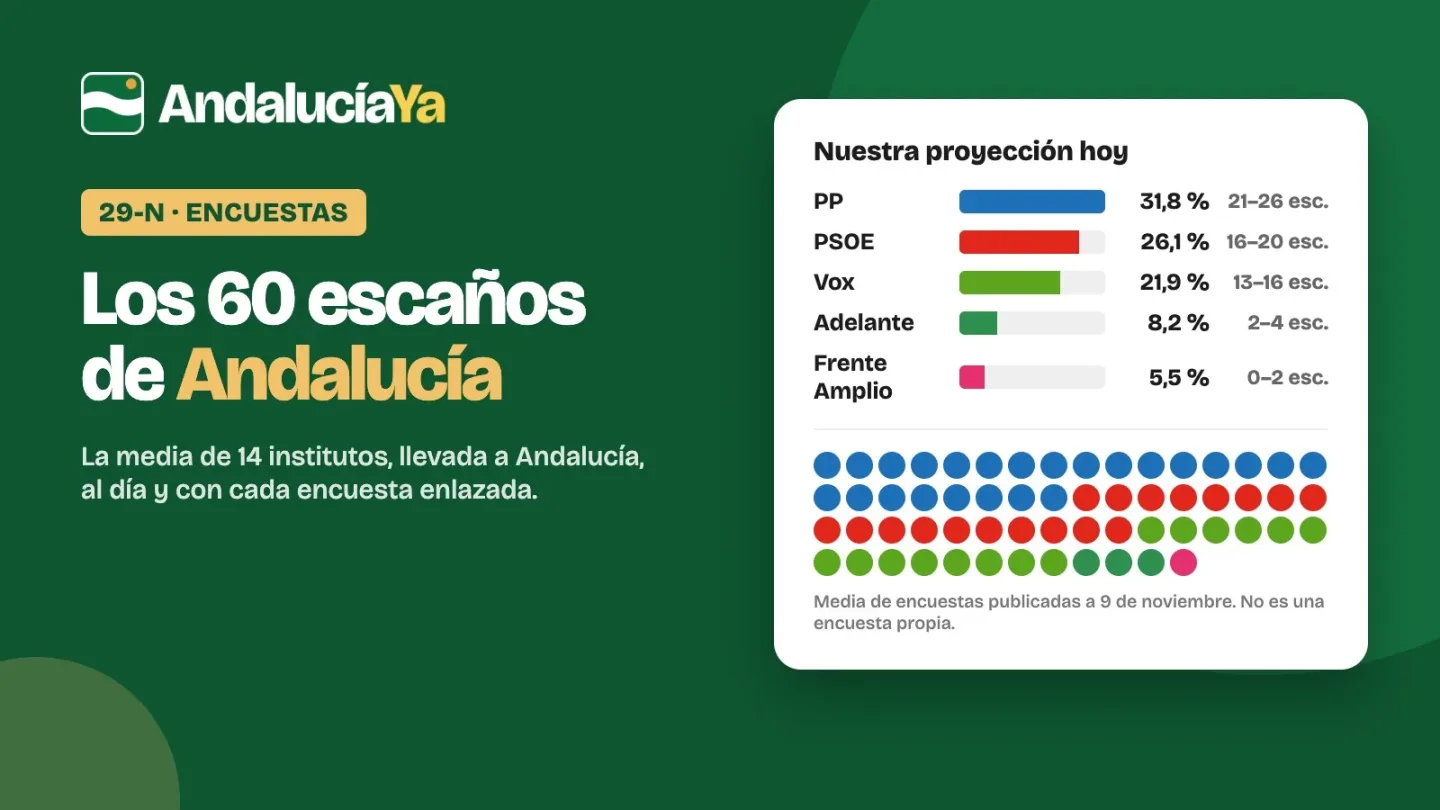
With the polls revised on November 9, the PP would be first in Andalucía with 31.8% and 24 seats (range of 21 to 26), one fewer than the 25 in 2023. The PSOE would have 26.1% and 18 (from 16 to 20), three fewer. Vox would rise to 21.9% and 14 seats (from 13 to 16), five more than in 2023.
Adelante Andalucía, with 8.2%, would win 3 deputies (from 2 to 4), in Cádiz, Málaga and Sevilla. Frente Amplio, with 5.5%, would keep 1 in Sevilla, when Sumar won 6 in 2023.
For comparison, the section includes what the institutes publish for Andalucía: SocioMétrica, for El Español (fieldwork up to November 8), gives PP 24, PSOE 18, Vox 15 and Adelante 3, very close to our calculation.
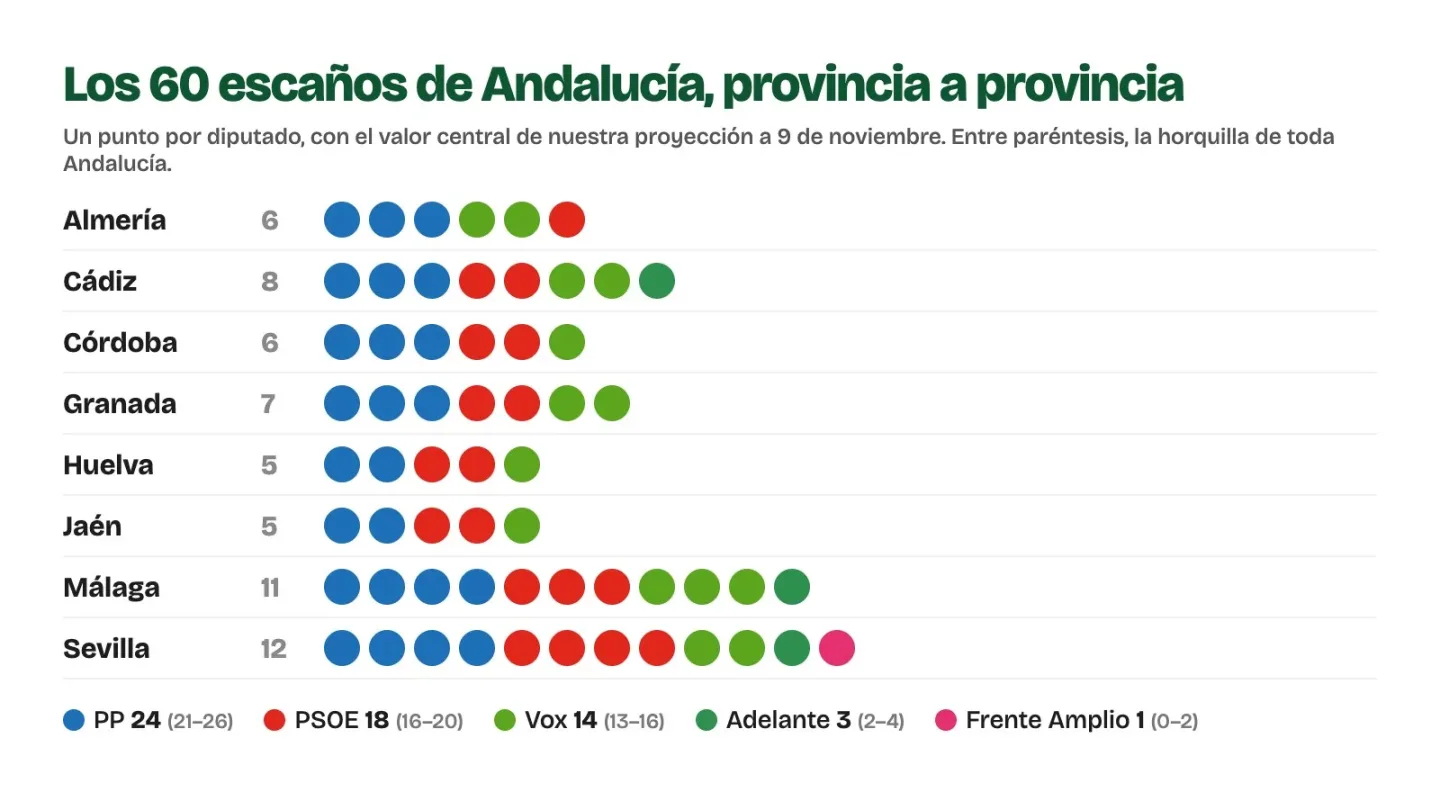
One dot per deputy, province by province. Photo: AndalucíaYa
This image summarises the «Province by province» table in the section: one dot per deputy with the central value of the projection. Each province has a link to its own special on the network's portal, where the calculation is seen in detail, with the seat-by-seat distribution.
Four steps and none of them secret. Photo: AndalucíaYa
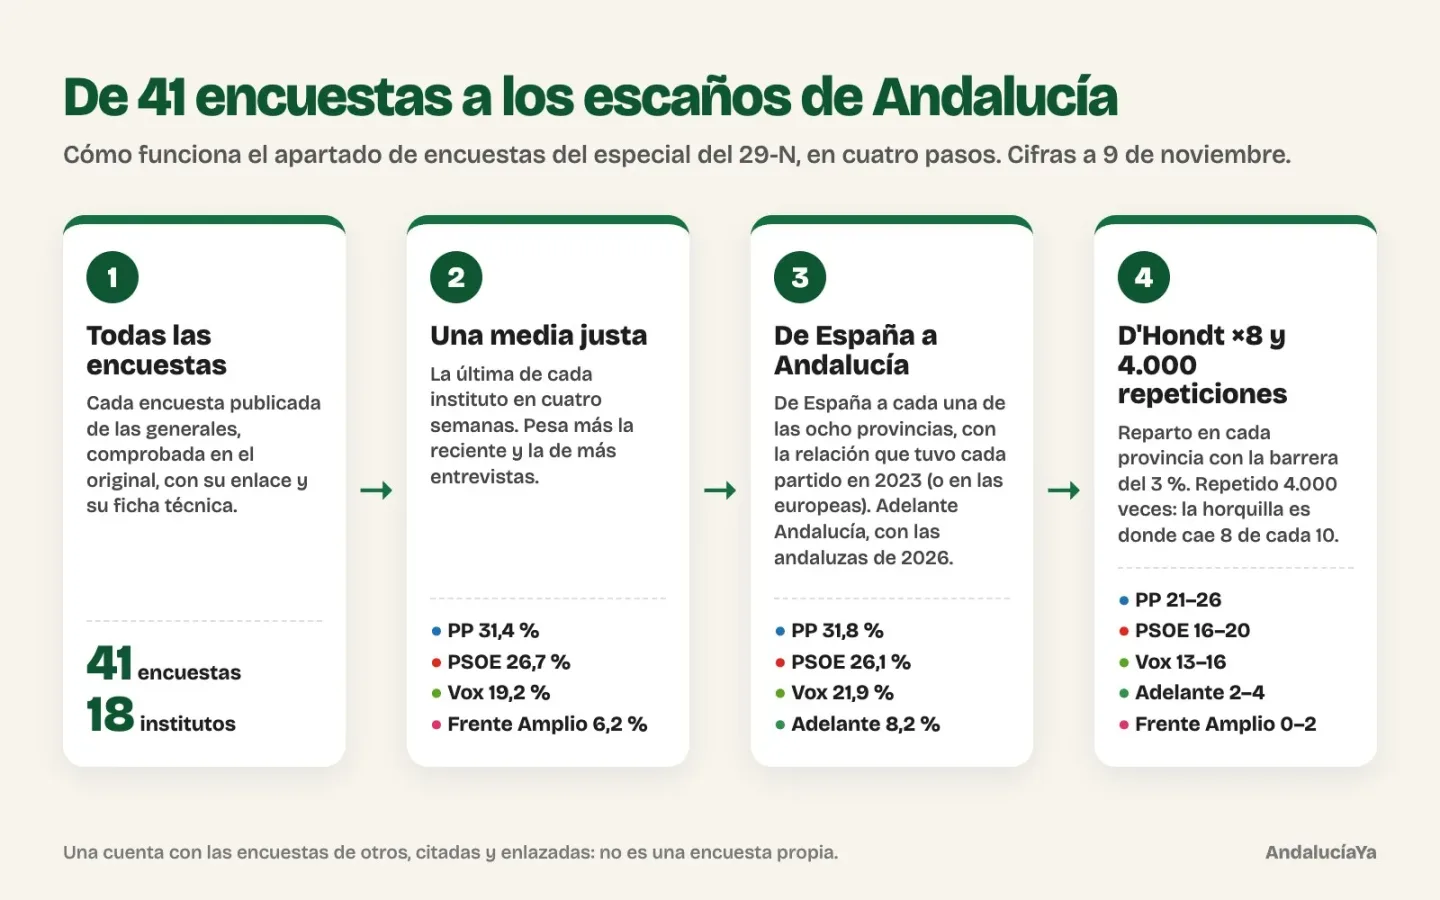
The first thing is to have all the polls. We don't choose the ones we like: all published polls for these general elections go in, 41 since October 1, always seen in their original source.
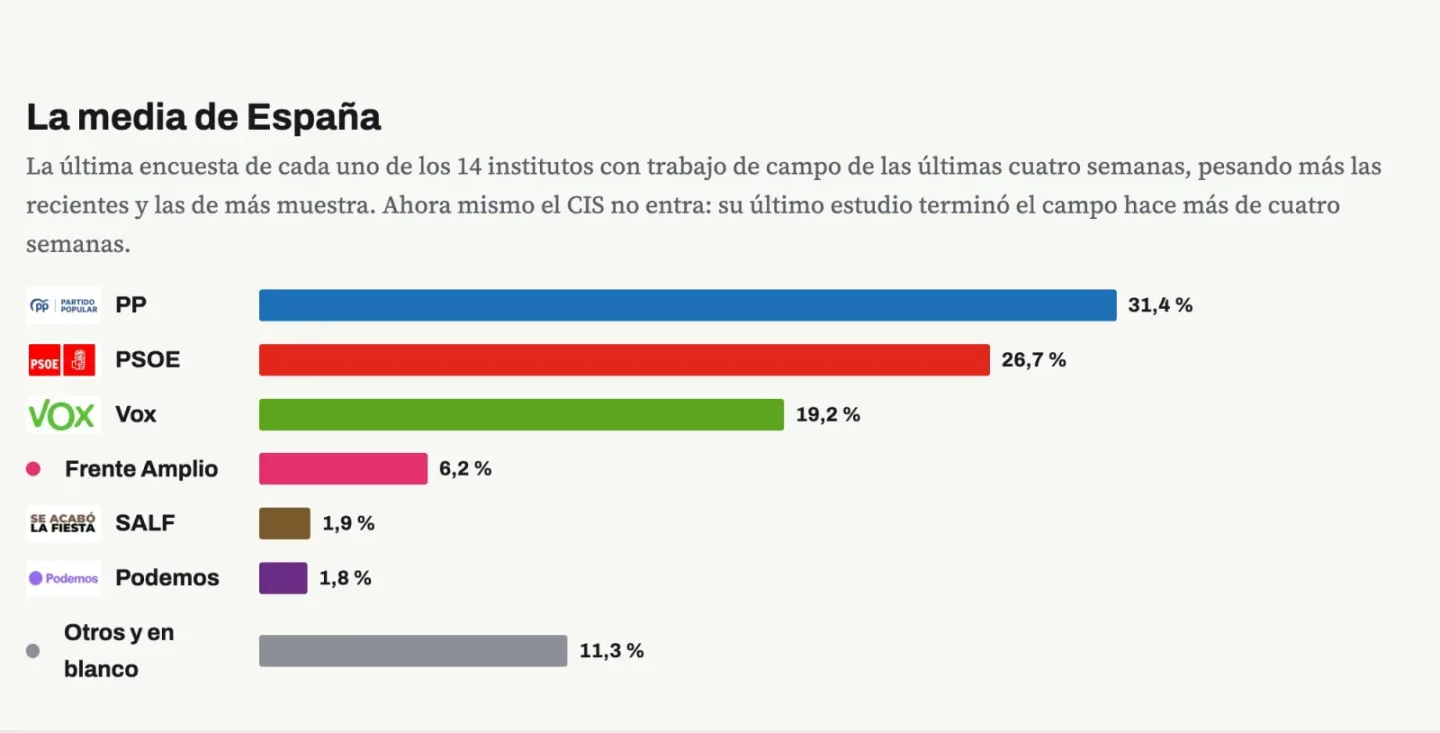
The second, average them so that none dominates. From each institute, the most recent; if it is more than four weeks old, out. One with 4,000 interviews weighs more than one with 1,000, but not four times more (the square root of the sample counts), and one from fifteen days ago weighs half as much as one from today. That is how the 14 that make up today's average come out.
The third, bring that average to Andalucía. It is done province by province. Each party keeps in each one the relationship with its Spain result that it had in the 2023 general elections (the 2024 European elections for Podemos and SALF). Adelante Andalucía, which only runs here, goes from its percentage in Spain to the Andalusian one and is distributed by provinces as in the May 2026 regional elections. Then each province is readjusted to add up to 100.
The fourth, turn it into seats. In each of the eight provinces its seats are distributed with the D'Hondt law and the 3% threshold, and Andalucía is the sum. The calculation is repeated 4,000 times moving each party at random, with a common error for all of Spain and another specific to each province: the range is where the result falls 8 out of 10 times.
The Andalucía projection comes from this average. Photo: AndalucíaYa
With the CIS or without the CIS
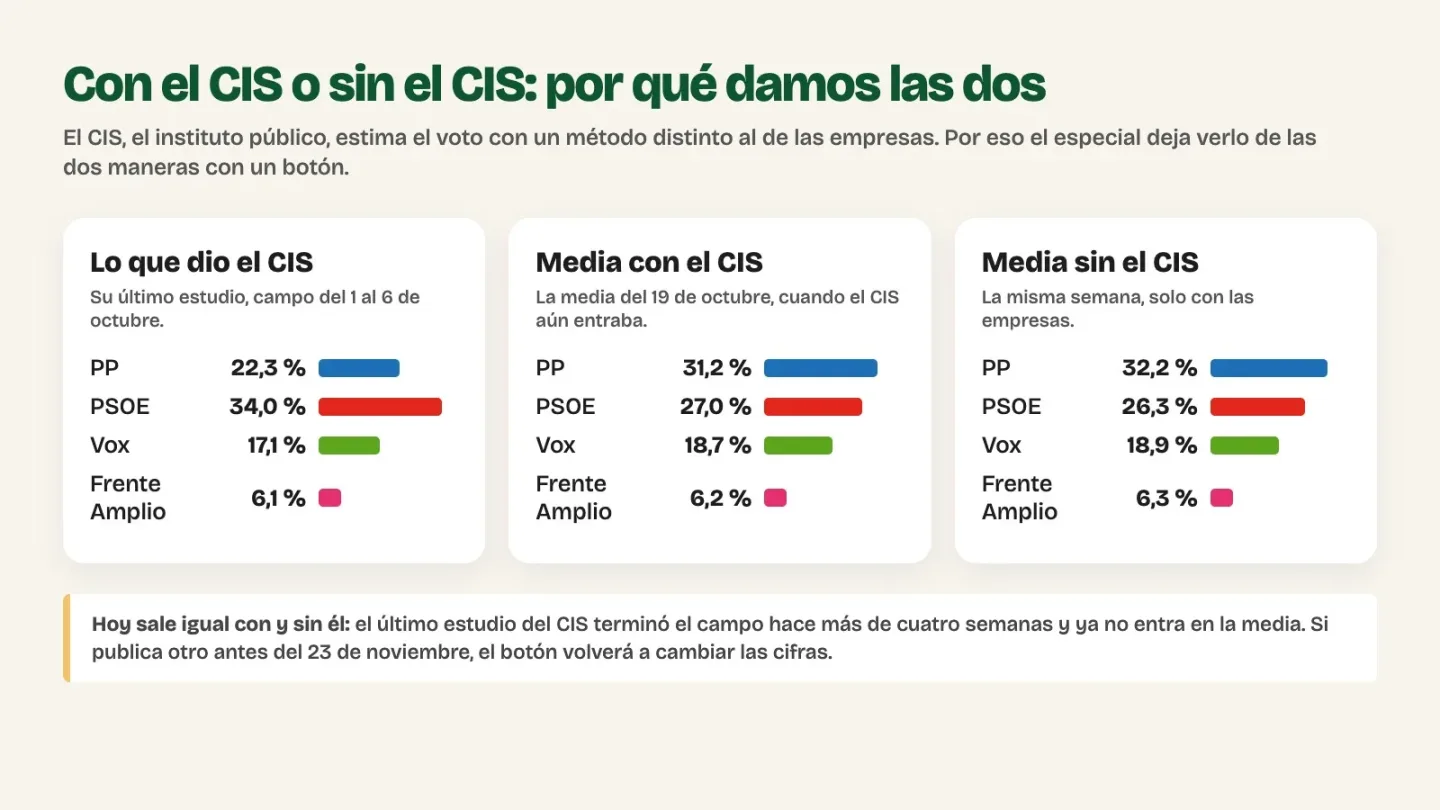
The CIS versus the average, with and without it. Photo: AndalucíaYa
The CIS is the Centro de Investigaciones Sociológicas, the public institute. Its way of estimating the vote is different from that of the companies, and its figures usually end up far from the others: in its latest study, with fieldwork from October 1 to 6, it gave the PSOE 34.0% and the PP 22.3%, when the average of the companies put the PP ahead.
That is why the special lets you choose. With the «With the CIS / Without the CIS» button you see how the average changes depending on whether you count it or not. On October 19, for example, with the CIS included, the average gave the PP 31.2% and the PSOE 27.0%; without it, 32.2% and 26.3%.
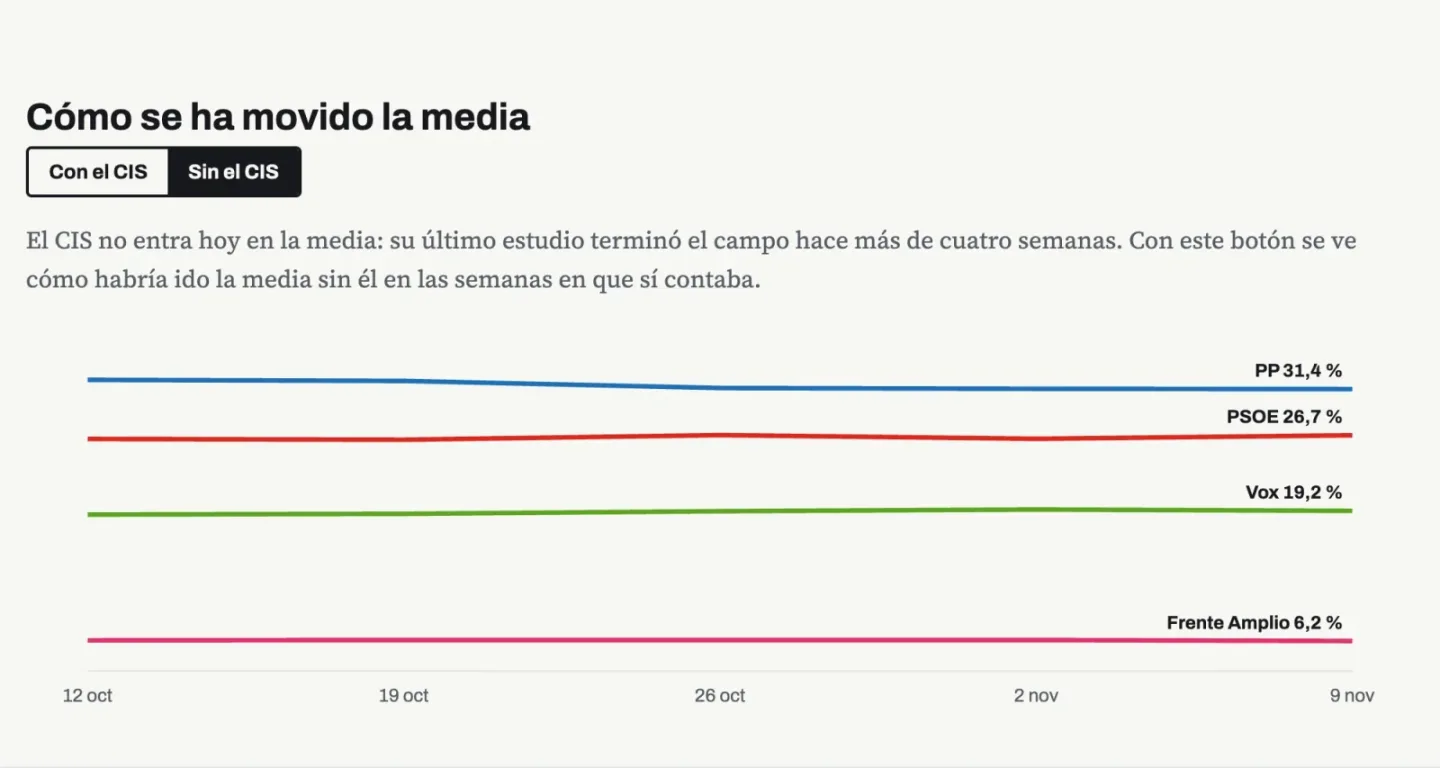
Today the CIS is not included: its latest study finished fieldwork more than four weeks ago. As long as that is the case, the projection comes out only once and the button stays next to the average chart, which is where it shows. If the CIS publishes another study before November 23, the button will change the projection again too.
The average chart in the AndalucíaYa special, with the CIS switch. Photo: AndalucíaYa
Make your own calculation
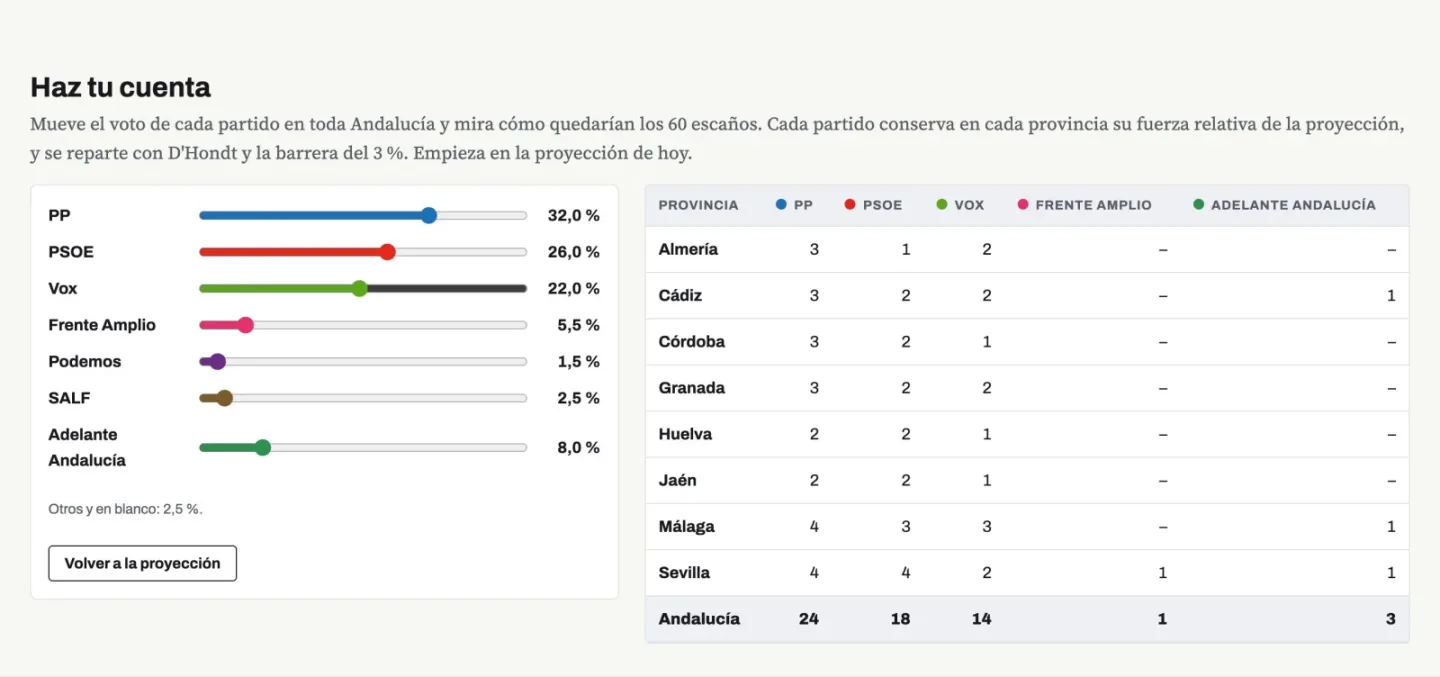
The AndalucíaYa special simulator, at its starting point. Photo: AndalucíaYa
The «Make your calculation» simulator is the most practical part of the section. Each party has a control with its vote in Andalucía and, when you move it, the table redistributes the seats in the eight provinces, with D'Hondt and the 3% threshold. Each party keeps its relative strength in each province according to the projection. With «Back to the projection» you return to the starting point.
All the polls, with their link
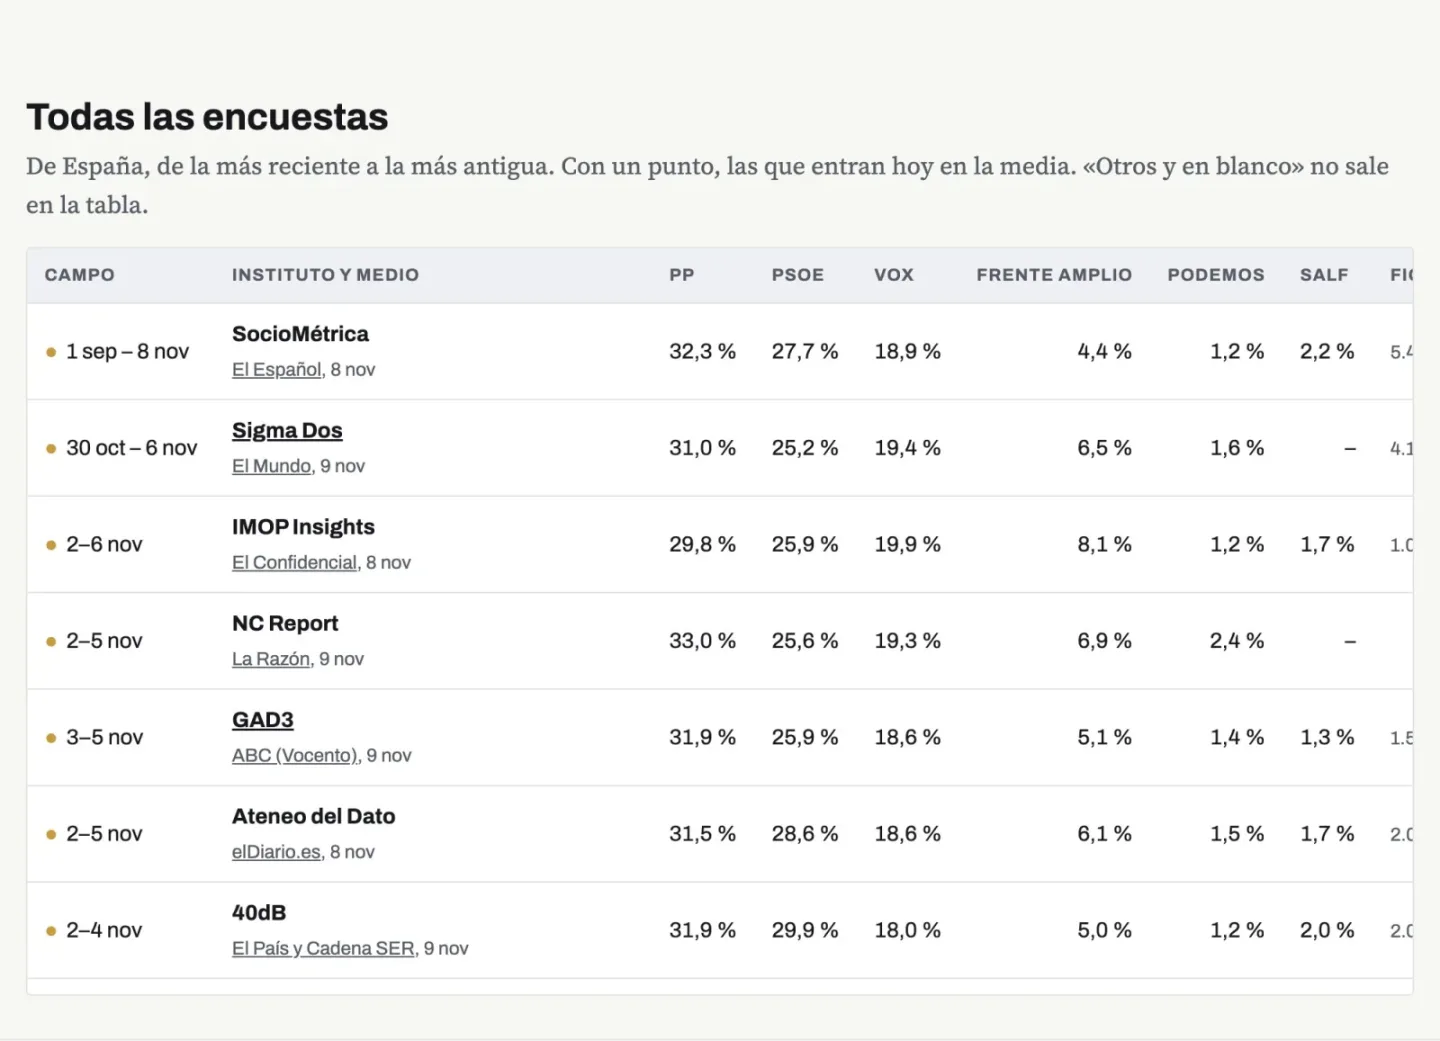
The table of all the polls: a dot marks the ones that count today. Photo: AndalucíaYa
The section closes with the table of the 41 polls, with fieldwork date, institute, outlet, each party's percentage in Spain and the technical details, and a link to the original of each one. The dot marks those that make up today's average.
Come back every day
The essentials to follow it
—When it updates: every day, until November 23. The date of the last revision is above.
—What changes: the average, the projection and the chart, when a new poll comes out or an old one expires after four weeks.
—What to look at: the trend of the chart and each party's range, rather than a single figure.
—From November 24 to 28: electoral law blackout. What's there from the 23rd stays, with a notice.